Why Optimizely's Users Quit Before They Start
Imagine paying for a tool that could transform how your team makes decisions, and then never using it because you couldn't get past the setup. That was the reality for a significant portion of Optimizely's Web Experimentation customers.
In partnership with Optimizely, we set out to understand why new users were abandoning one of their most powerful products. Our research directly influenced their roadmap, with a similar shipped feature showing customers creating 18% more tests and seeing 33% faster run times.
My Role:
UX Researcher (with Design contributions)
Scope:
Mixed-Methods Research · Competitive Analysis · Heuristic Evaluation · Moderated Usability Testing · Journey Mapping
Capstone Sponsor:
Team:

2 Researchers · 2 Designers
Timeline:
4 Months
Background
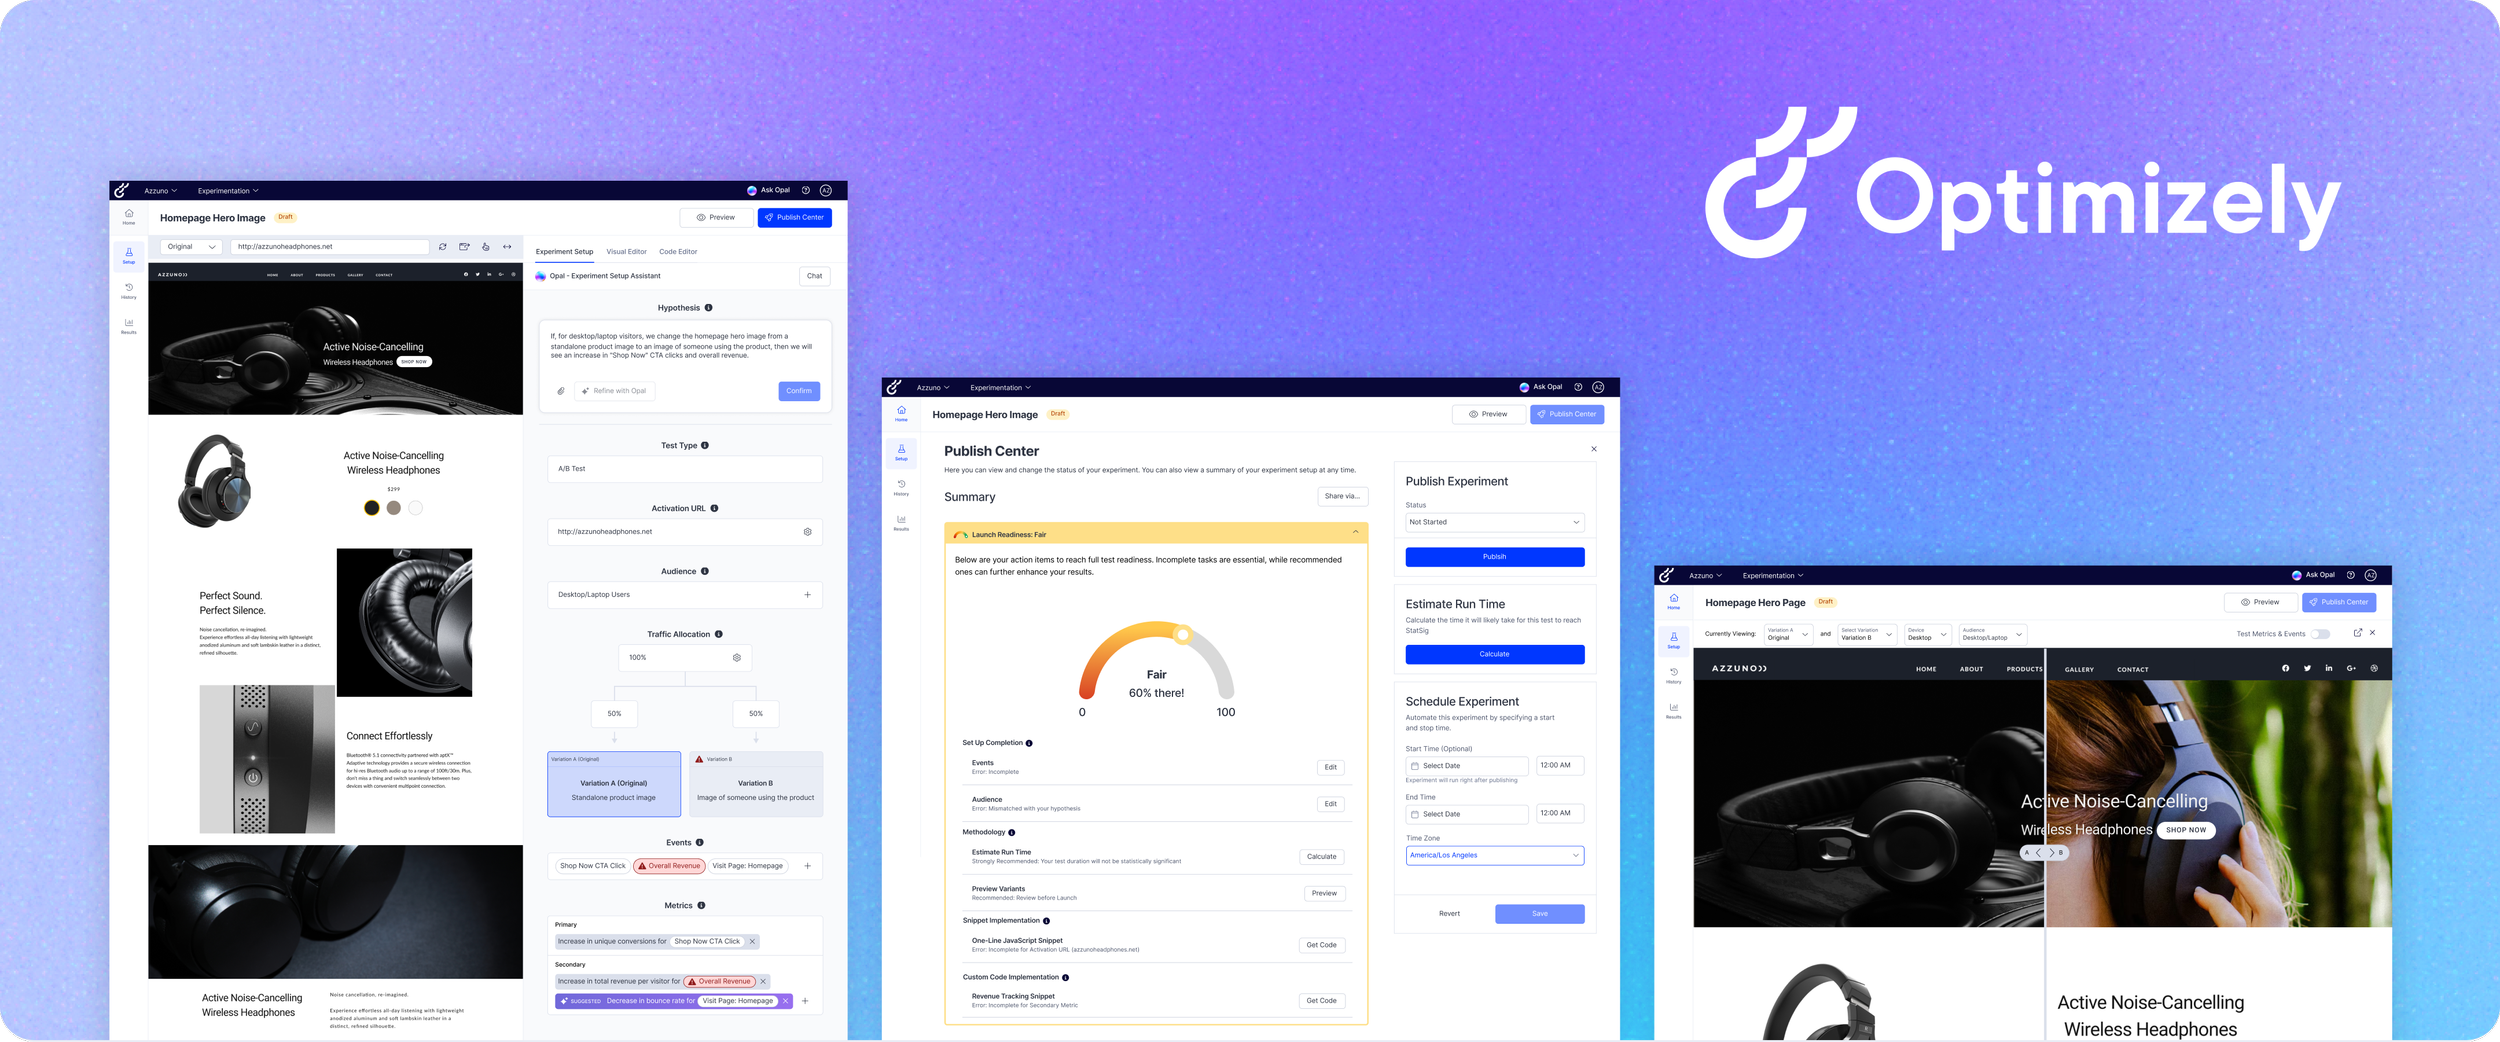
Optimizely is a B2B SaaS company that offers a suite of tools for marketing teams. One of its core products is Web Experimentation (WebEx), a platform that helps businesses run A/B tests and multivariate experiments on their digital experiences. But the data revealed a significant gap between the platform's potential and how customers were actually experiencing it.
With nearly 1,300 customers, Web Experimentation is a core offering, yet it has a 65% retention rate, the lowest of any Optimizely product.
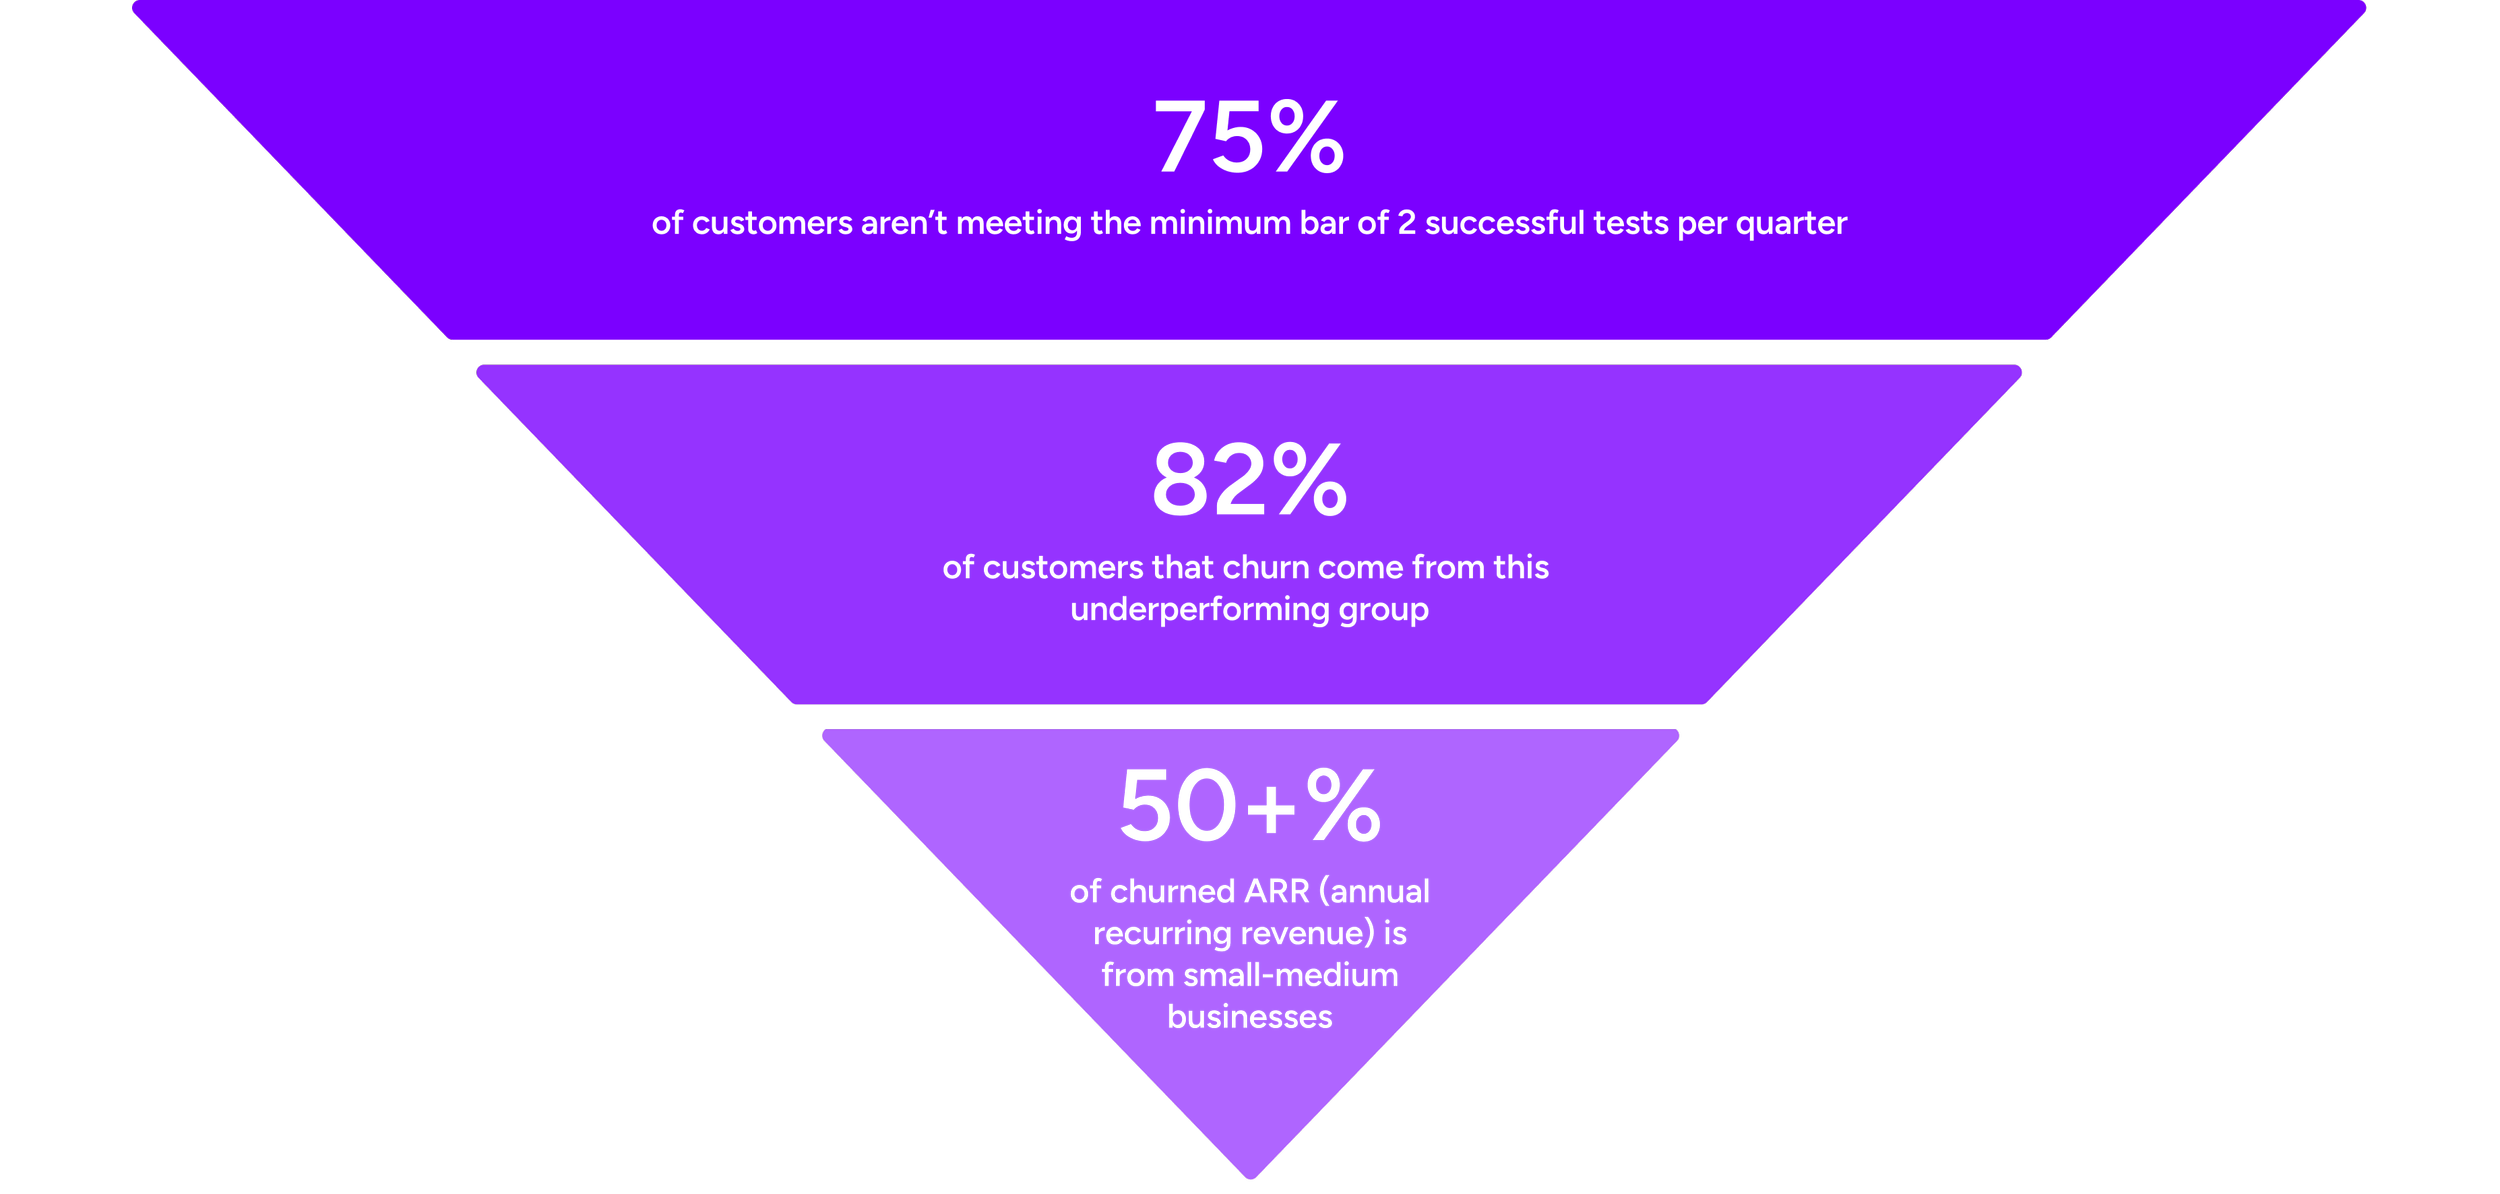
Small-medium business marketers were the most affected, often lacking a dedicated experimentation role or access to Optimizely's premium onboarding support. They were the most likely to struggle, and the most likely to leave, making them thenatural focus of our research.
Goals and Objectives
Develop a comprehensive understanding of the current Web Experimentation onboarding process for self-serve users to evaluate alignment with their needs and expectations.
1
Determine user pain points and opportunities to inform a reimagined onboarding experience designed to drive early engagement, build trust, and facilitate seamless self-service.
2
Format & Methods
Phase 1 -Desk Research
Competitive Analysis
I reviewed six direct and indirect Optimizely competitors to understand industry onboarding standards and identify best practices.
Heuristic Evaluation
The team simulated a new client flow end-to-end on WebEx itself, from account activation to creating an A/B test, to get a firsthand picture of the experience before speaking to any users.
Phase 2 -Contextual Usability Study
I developed the task flow and screener, overseeing recruitment to ensure we were speaking to the right participants. The team ran 6 moderated sessions, of which I personally moderated 2.
The contextual framing allowed us to identify usability issues, uncover user expectations and mental models, and validate findings from the heuristic evaluation — all while capturing the moments of confusion and frustration that SEQ scores alone would have missed.
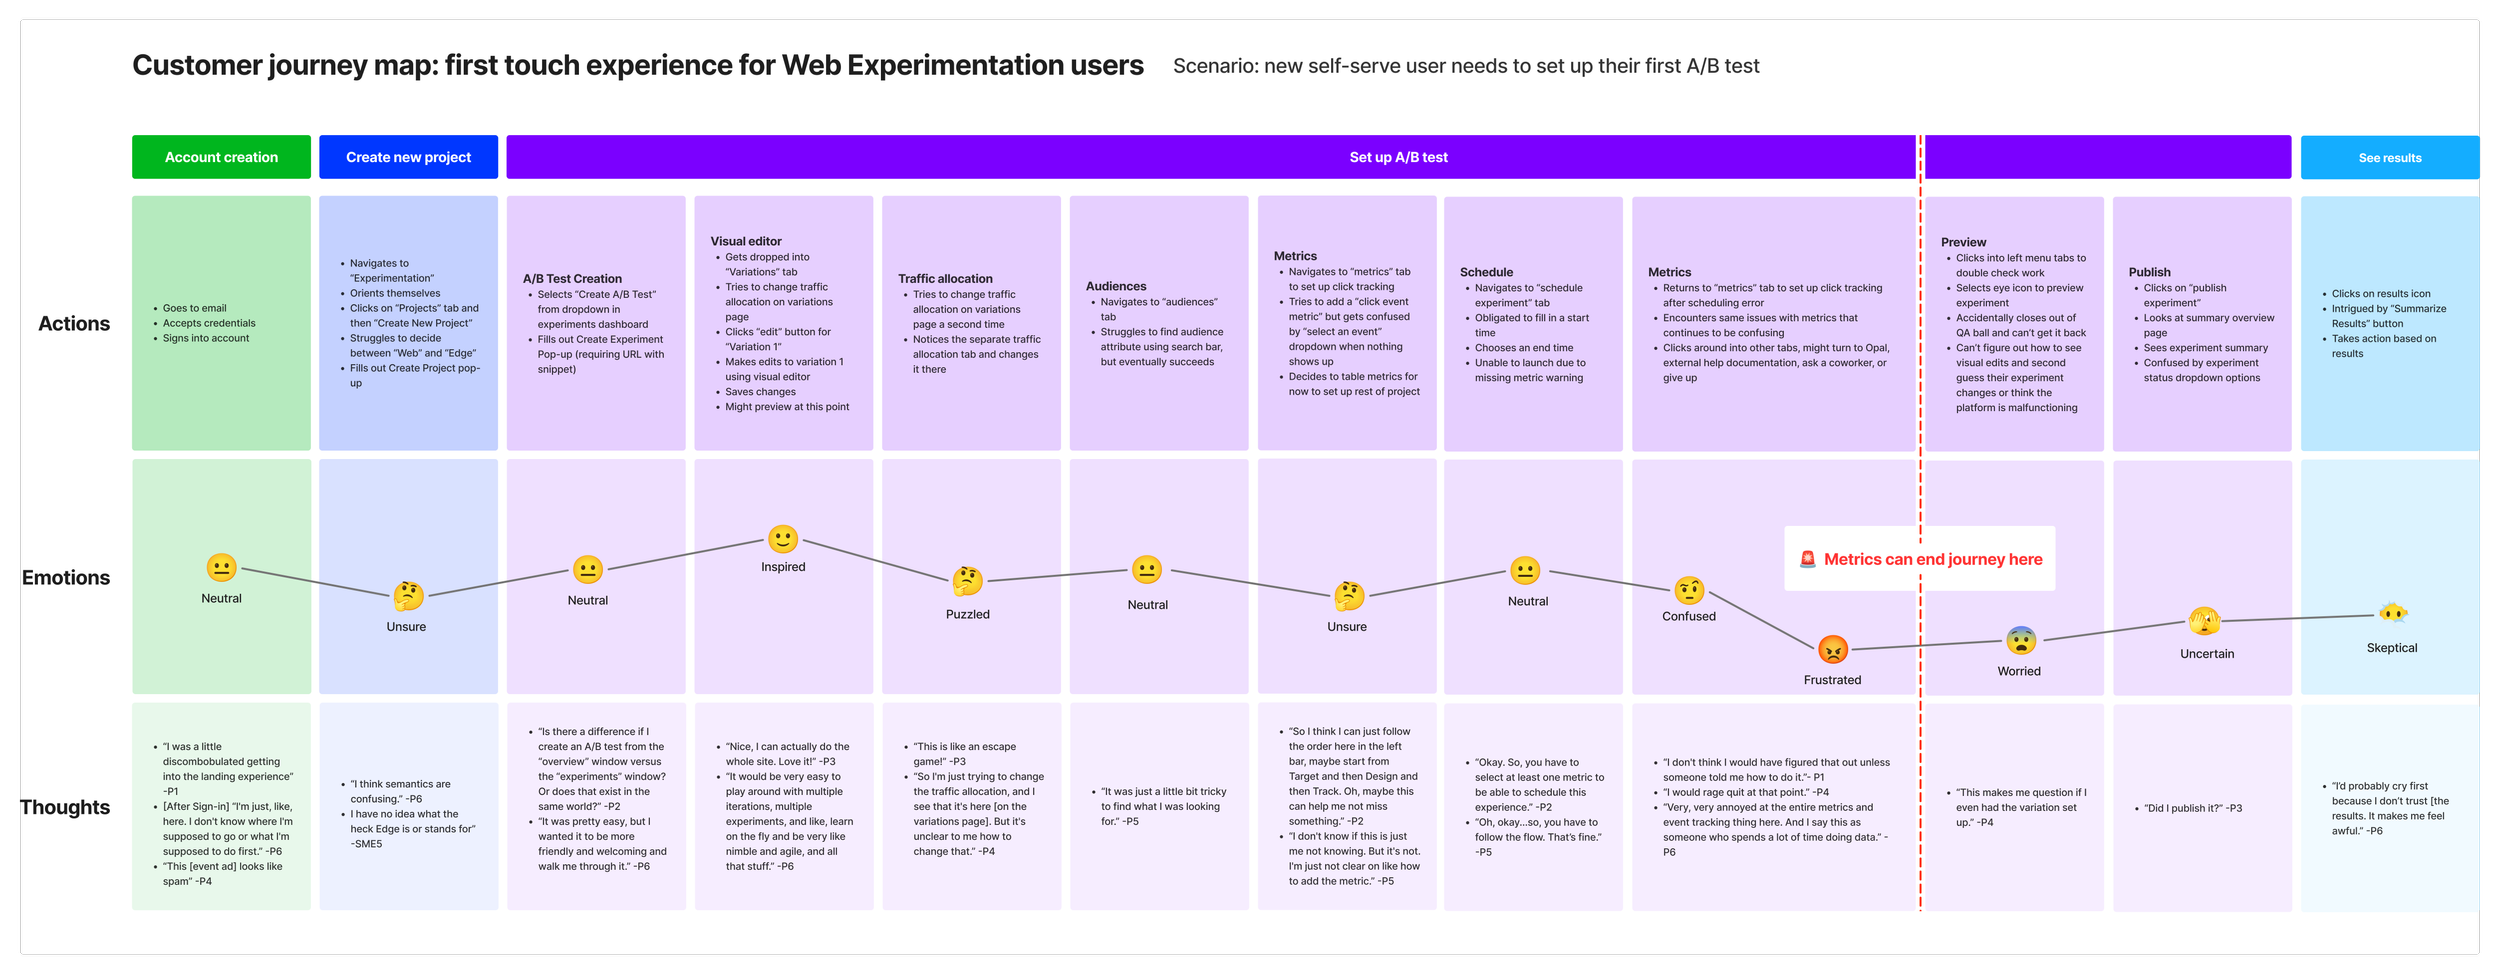
Resulting Customer Journey Map from Usability Study
Sample & Screener Criteria
6 participants were recruited for 60-minute moderated usability sessions:
Full-time marketing or marketing-adjacent professionals
Active experience deploying A/B tests as part of their role
No prior Optimizely WebEx experience
Excluding existing Optimizely users was critical to capturing genuine first impressions.
Key Insights
Events & Metrics Compromise the First-Touch Experience
For first-time users, configuring Events and Metrics consistently became a wall.
Participants couldn't articulate what these components were or how they related to each other, stalling the setup before it ever got momentum
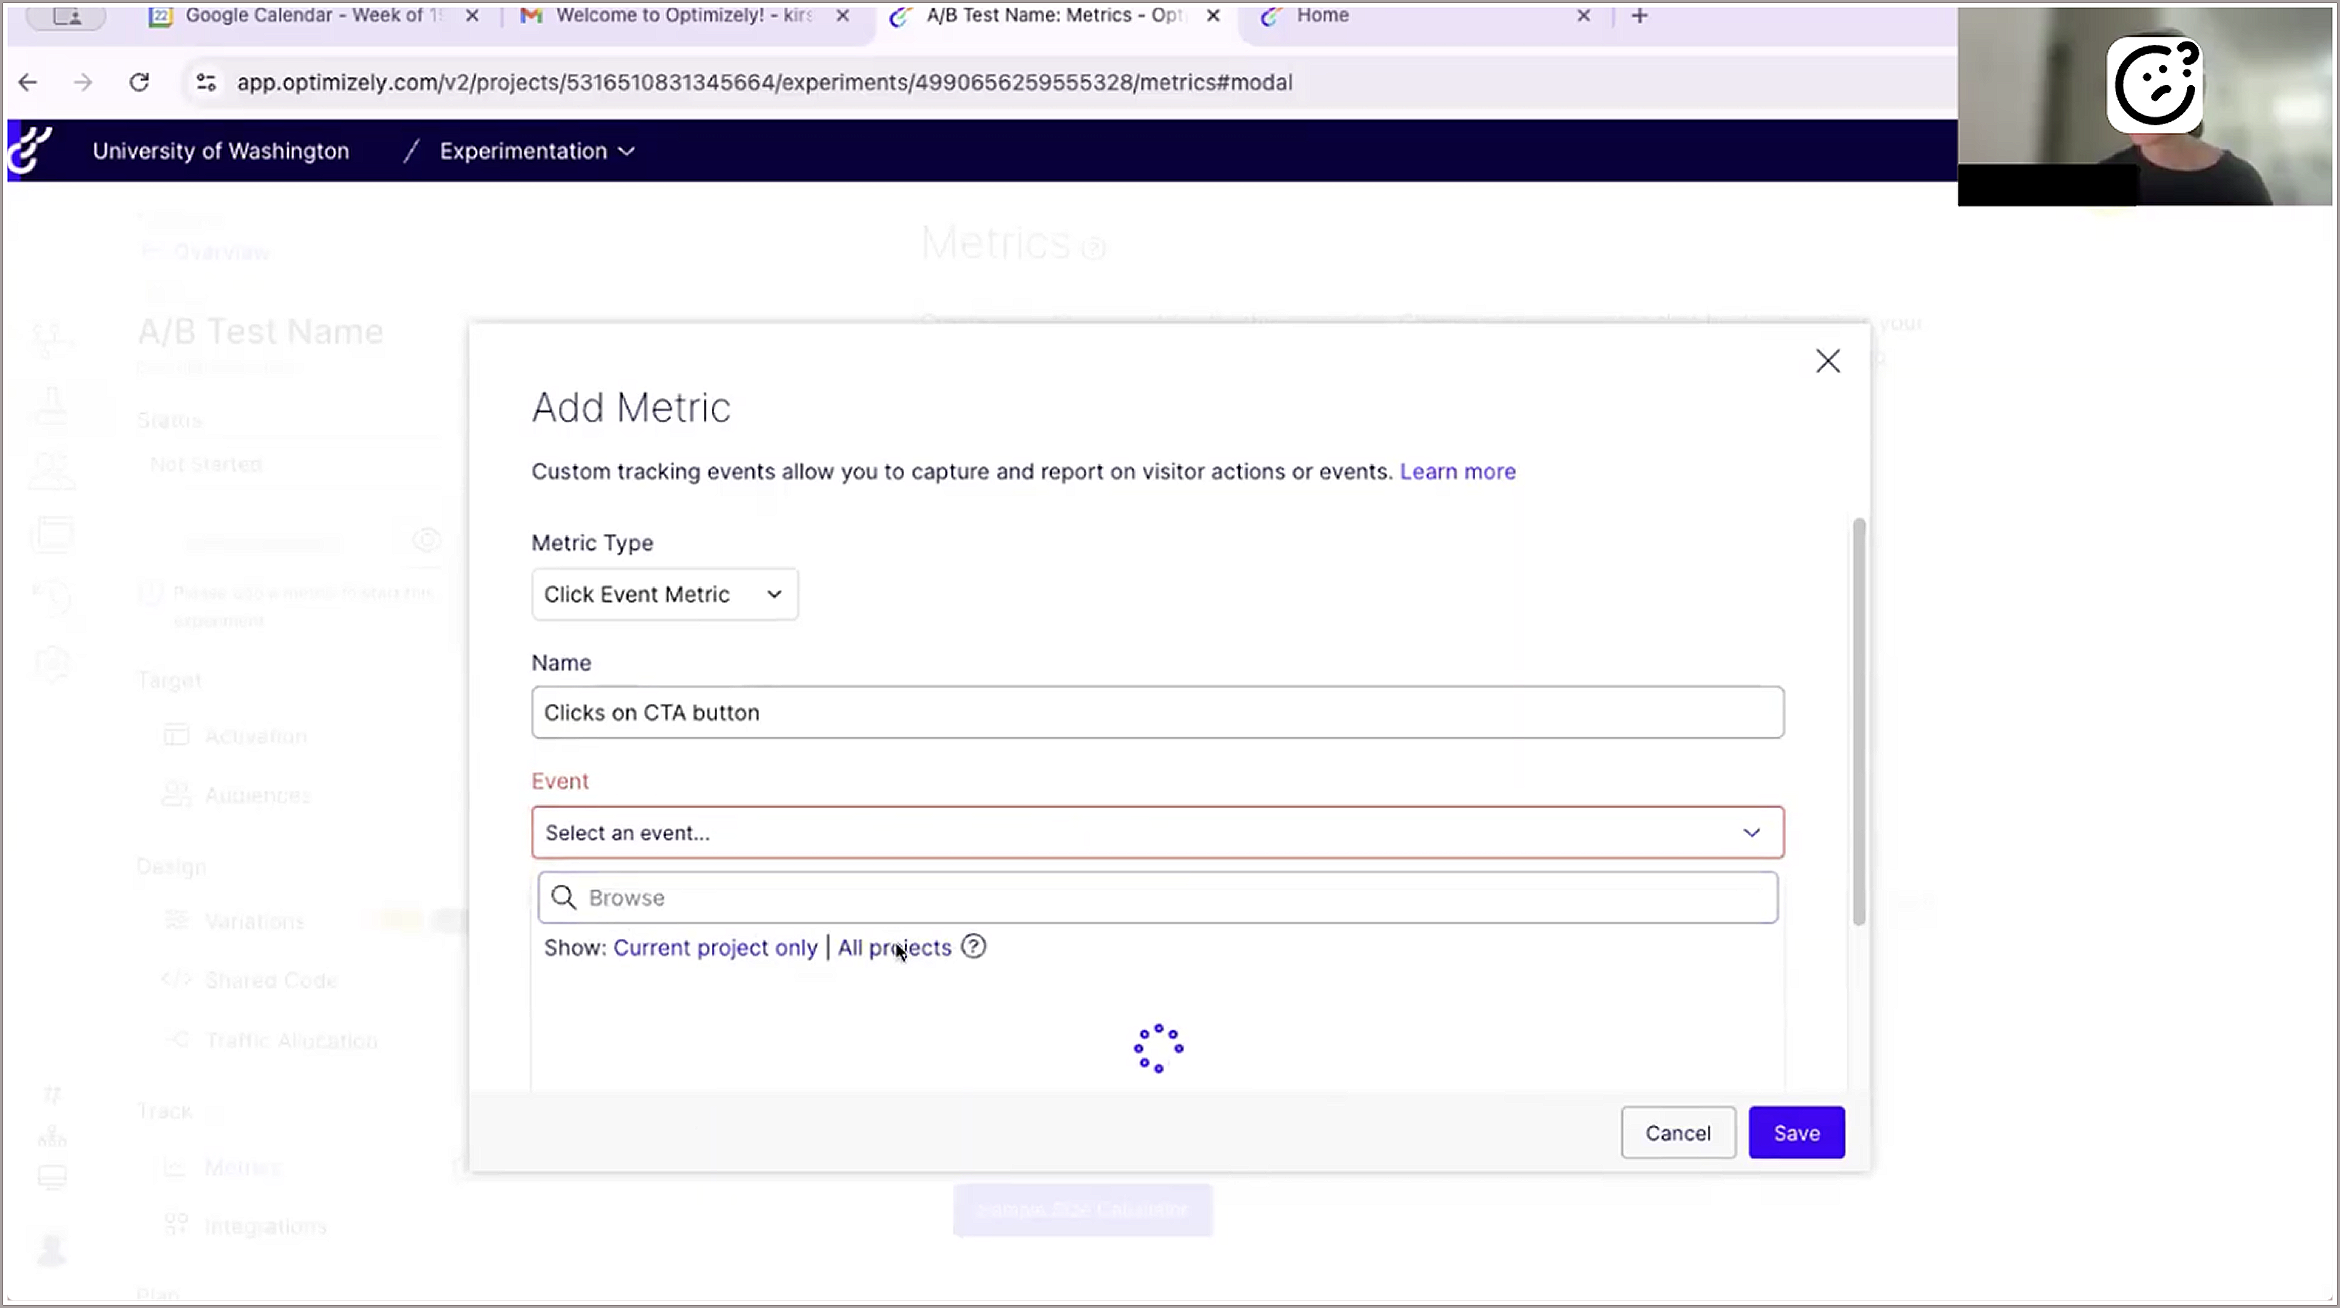
P5 Getting Stuck at Metrics Task
Help Documentation is Impersonal and Disruptive
When users hit a roadblock, the platform sent them to external documentation. Rather than feeling supported, they felt abandoned and left to figure it out alone.
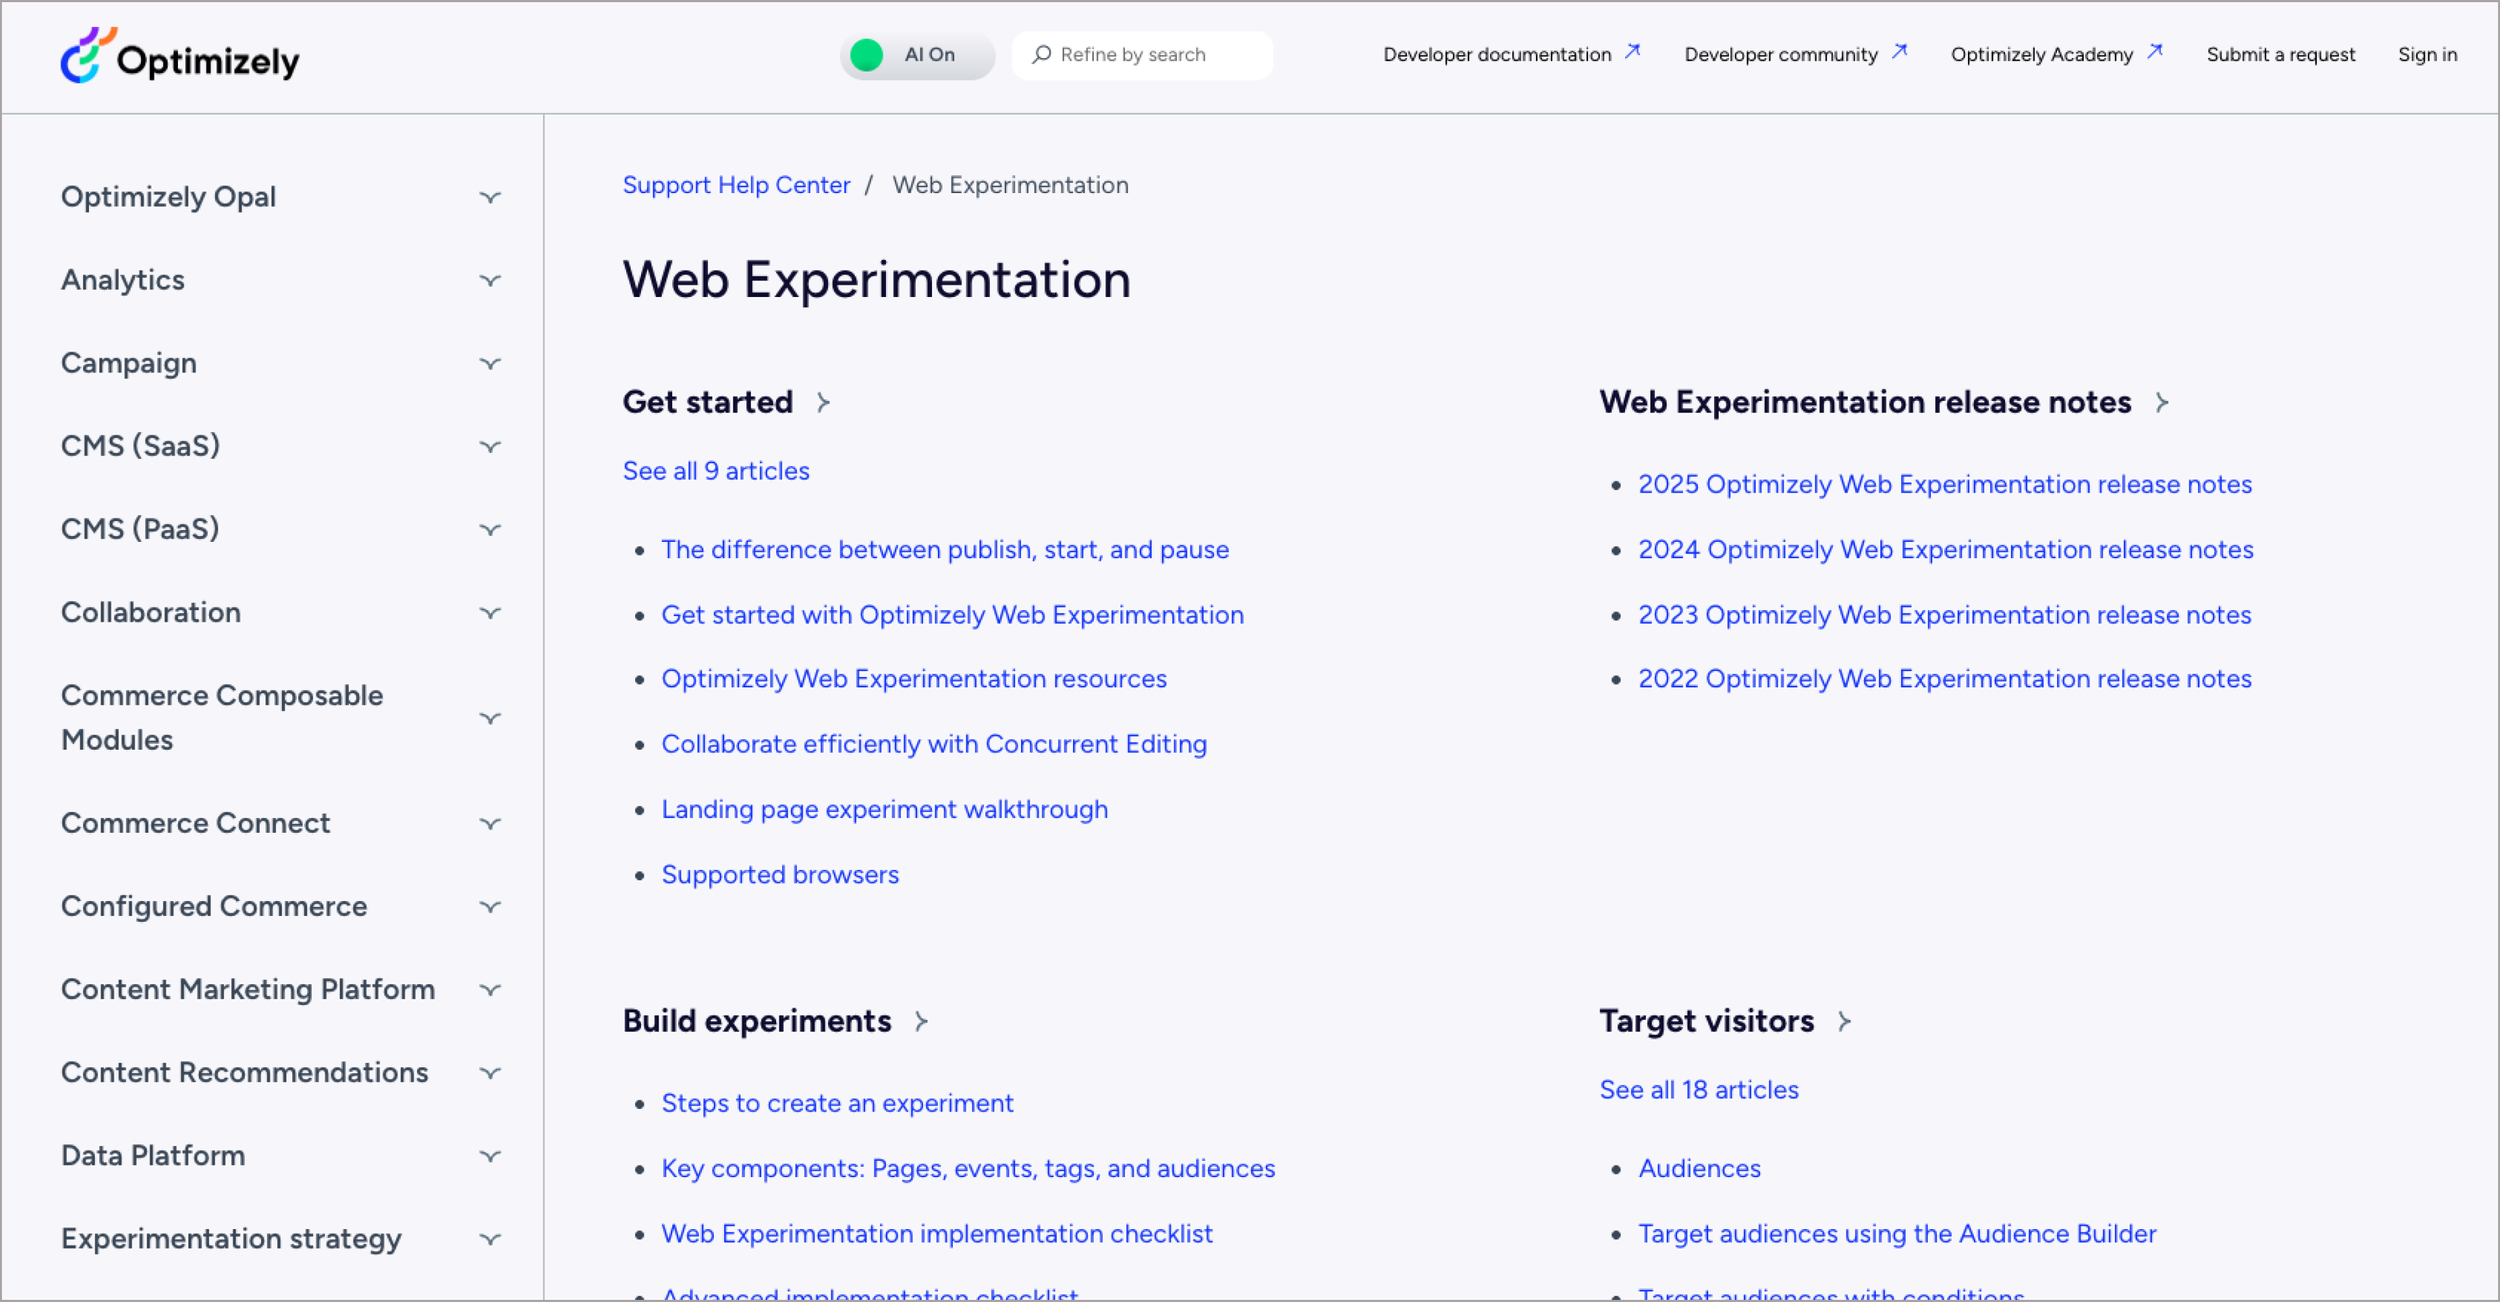
Support Help Center: Heavy reliance on external documentation
Users Lose Their Place in the Platform
Even when participants pushed past confusing steps, a larger problem persisted. With no progress indicators, orientation cues, or consistent language, users weren't just confused about terminology. They were lost in the platform itself.
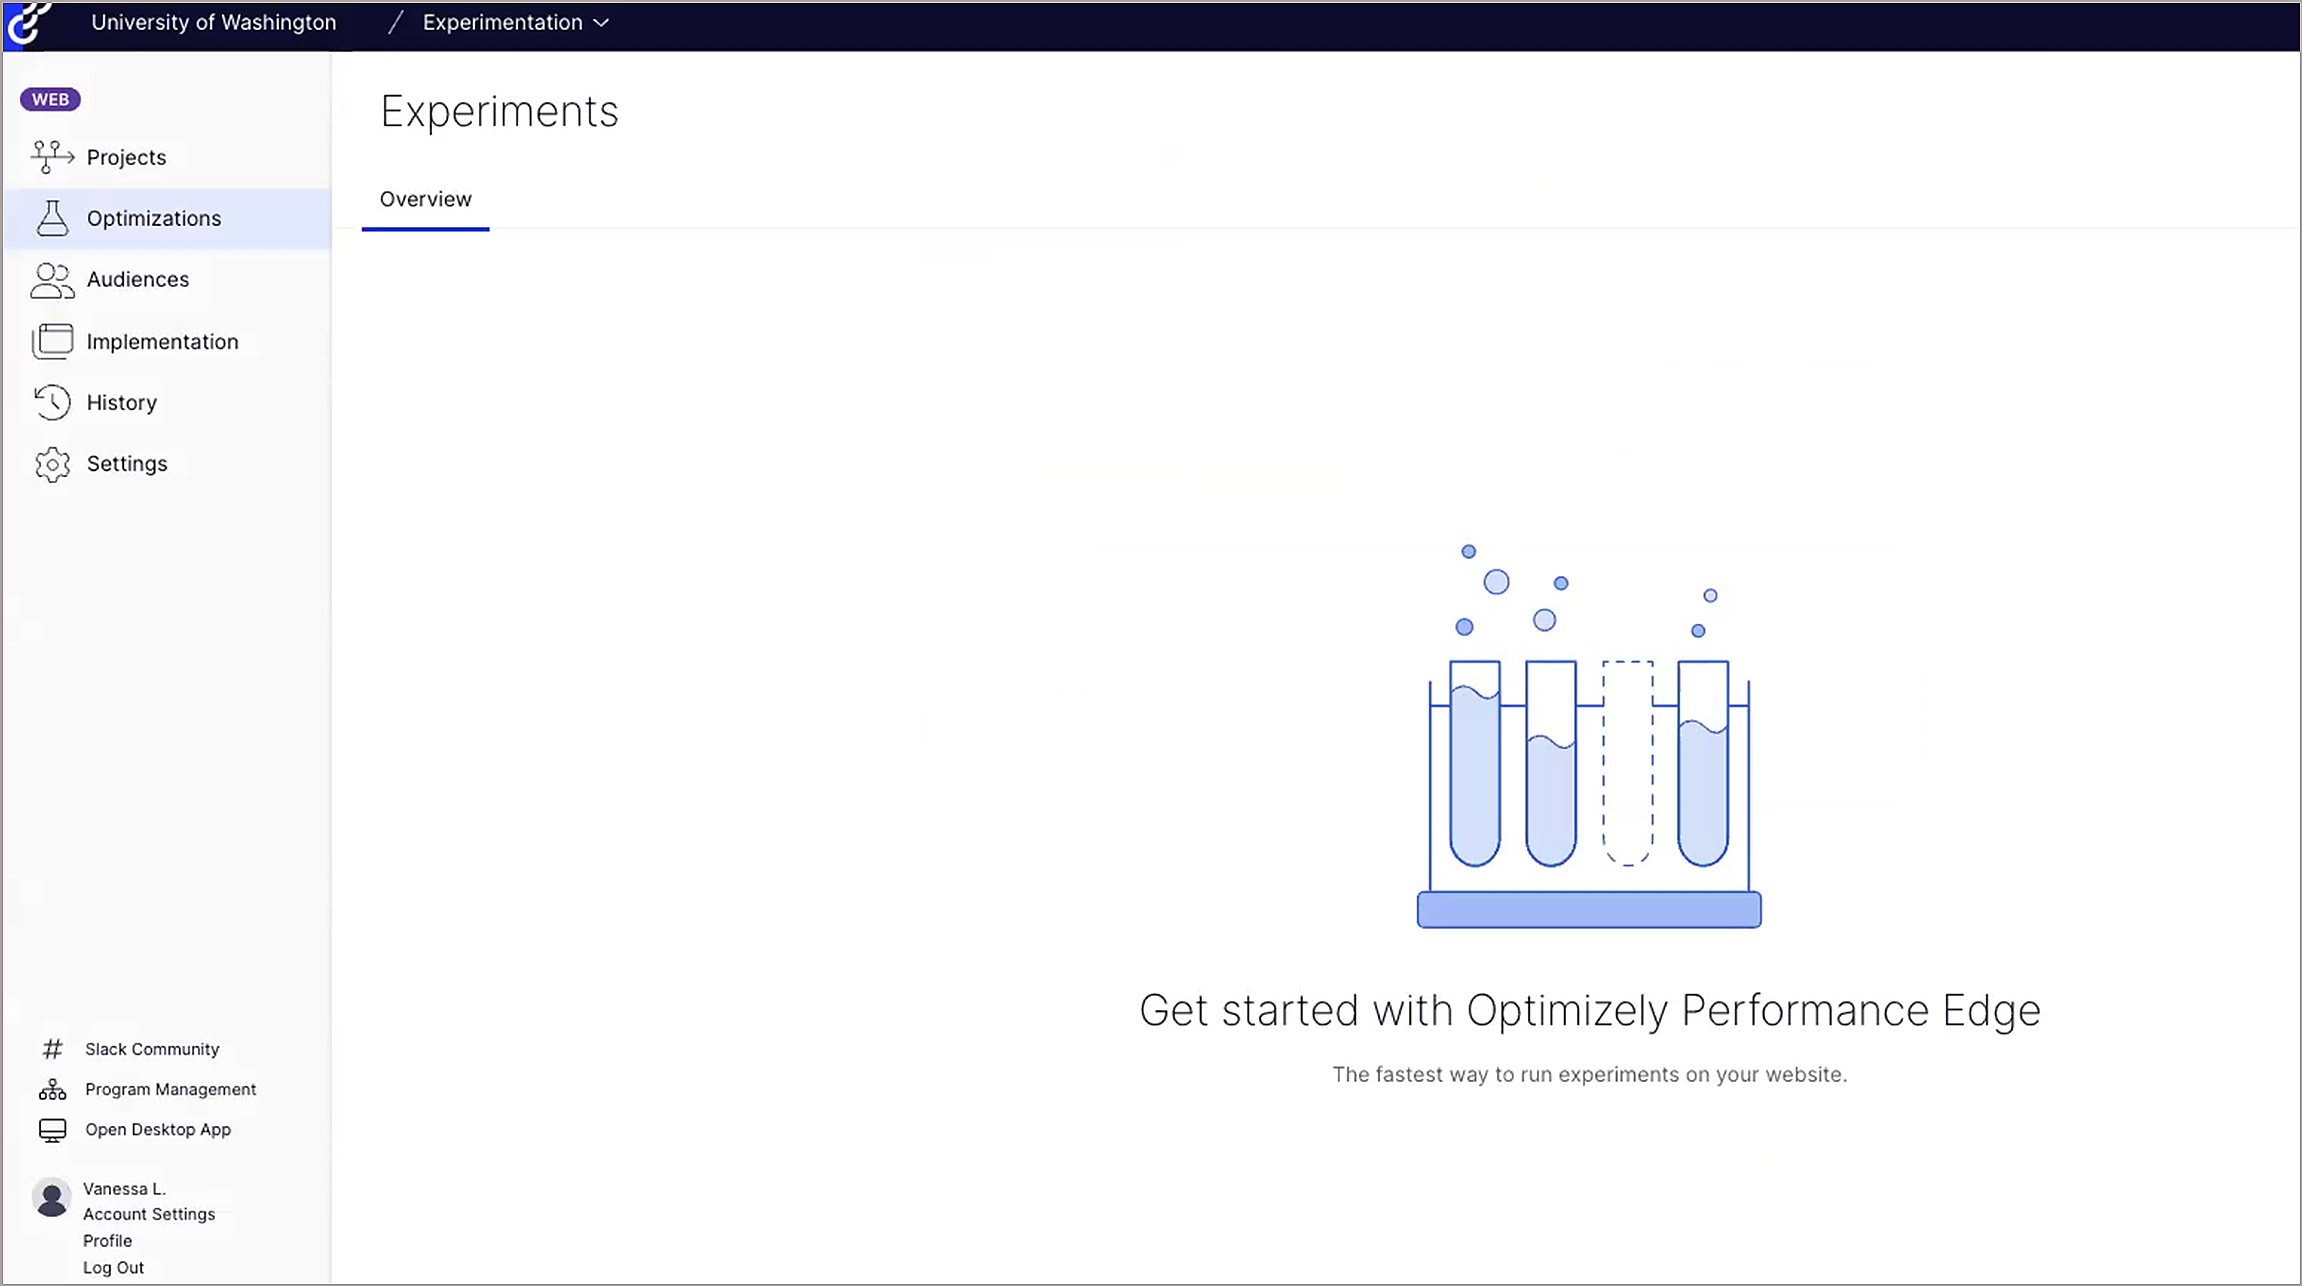
What new users see after creating their first “Project” on the Web Experimentation platform
Loss of Confidence Stems From a Lack of Feedback
Users completed actions without knowing if they were correct. Without signals that they were on the right track, confidence steadily declined, which was especially damaging for a platform whose value depends on users trusting their results.
“I would say in terms of like confidence... I felt like I was doing the wrong things... like, the right things... like there was a couple of things there that I was clicking around a little bit.” -P5
“I would probably cry first because I don’t trust [the results]. It makes me feel awful.” -P6, when asked what they would do to navigate to results after the experiment ends
Impact
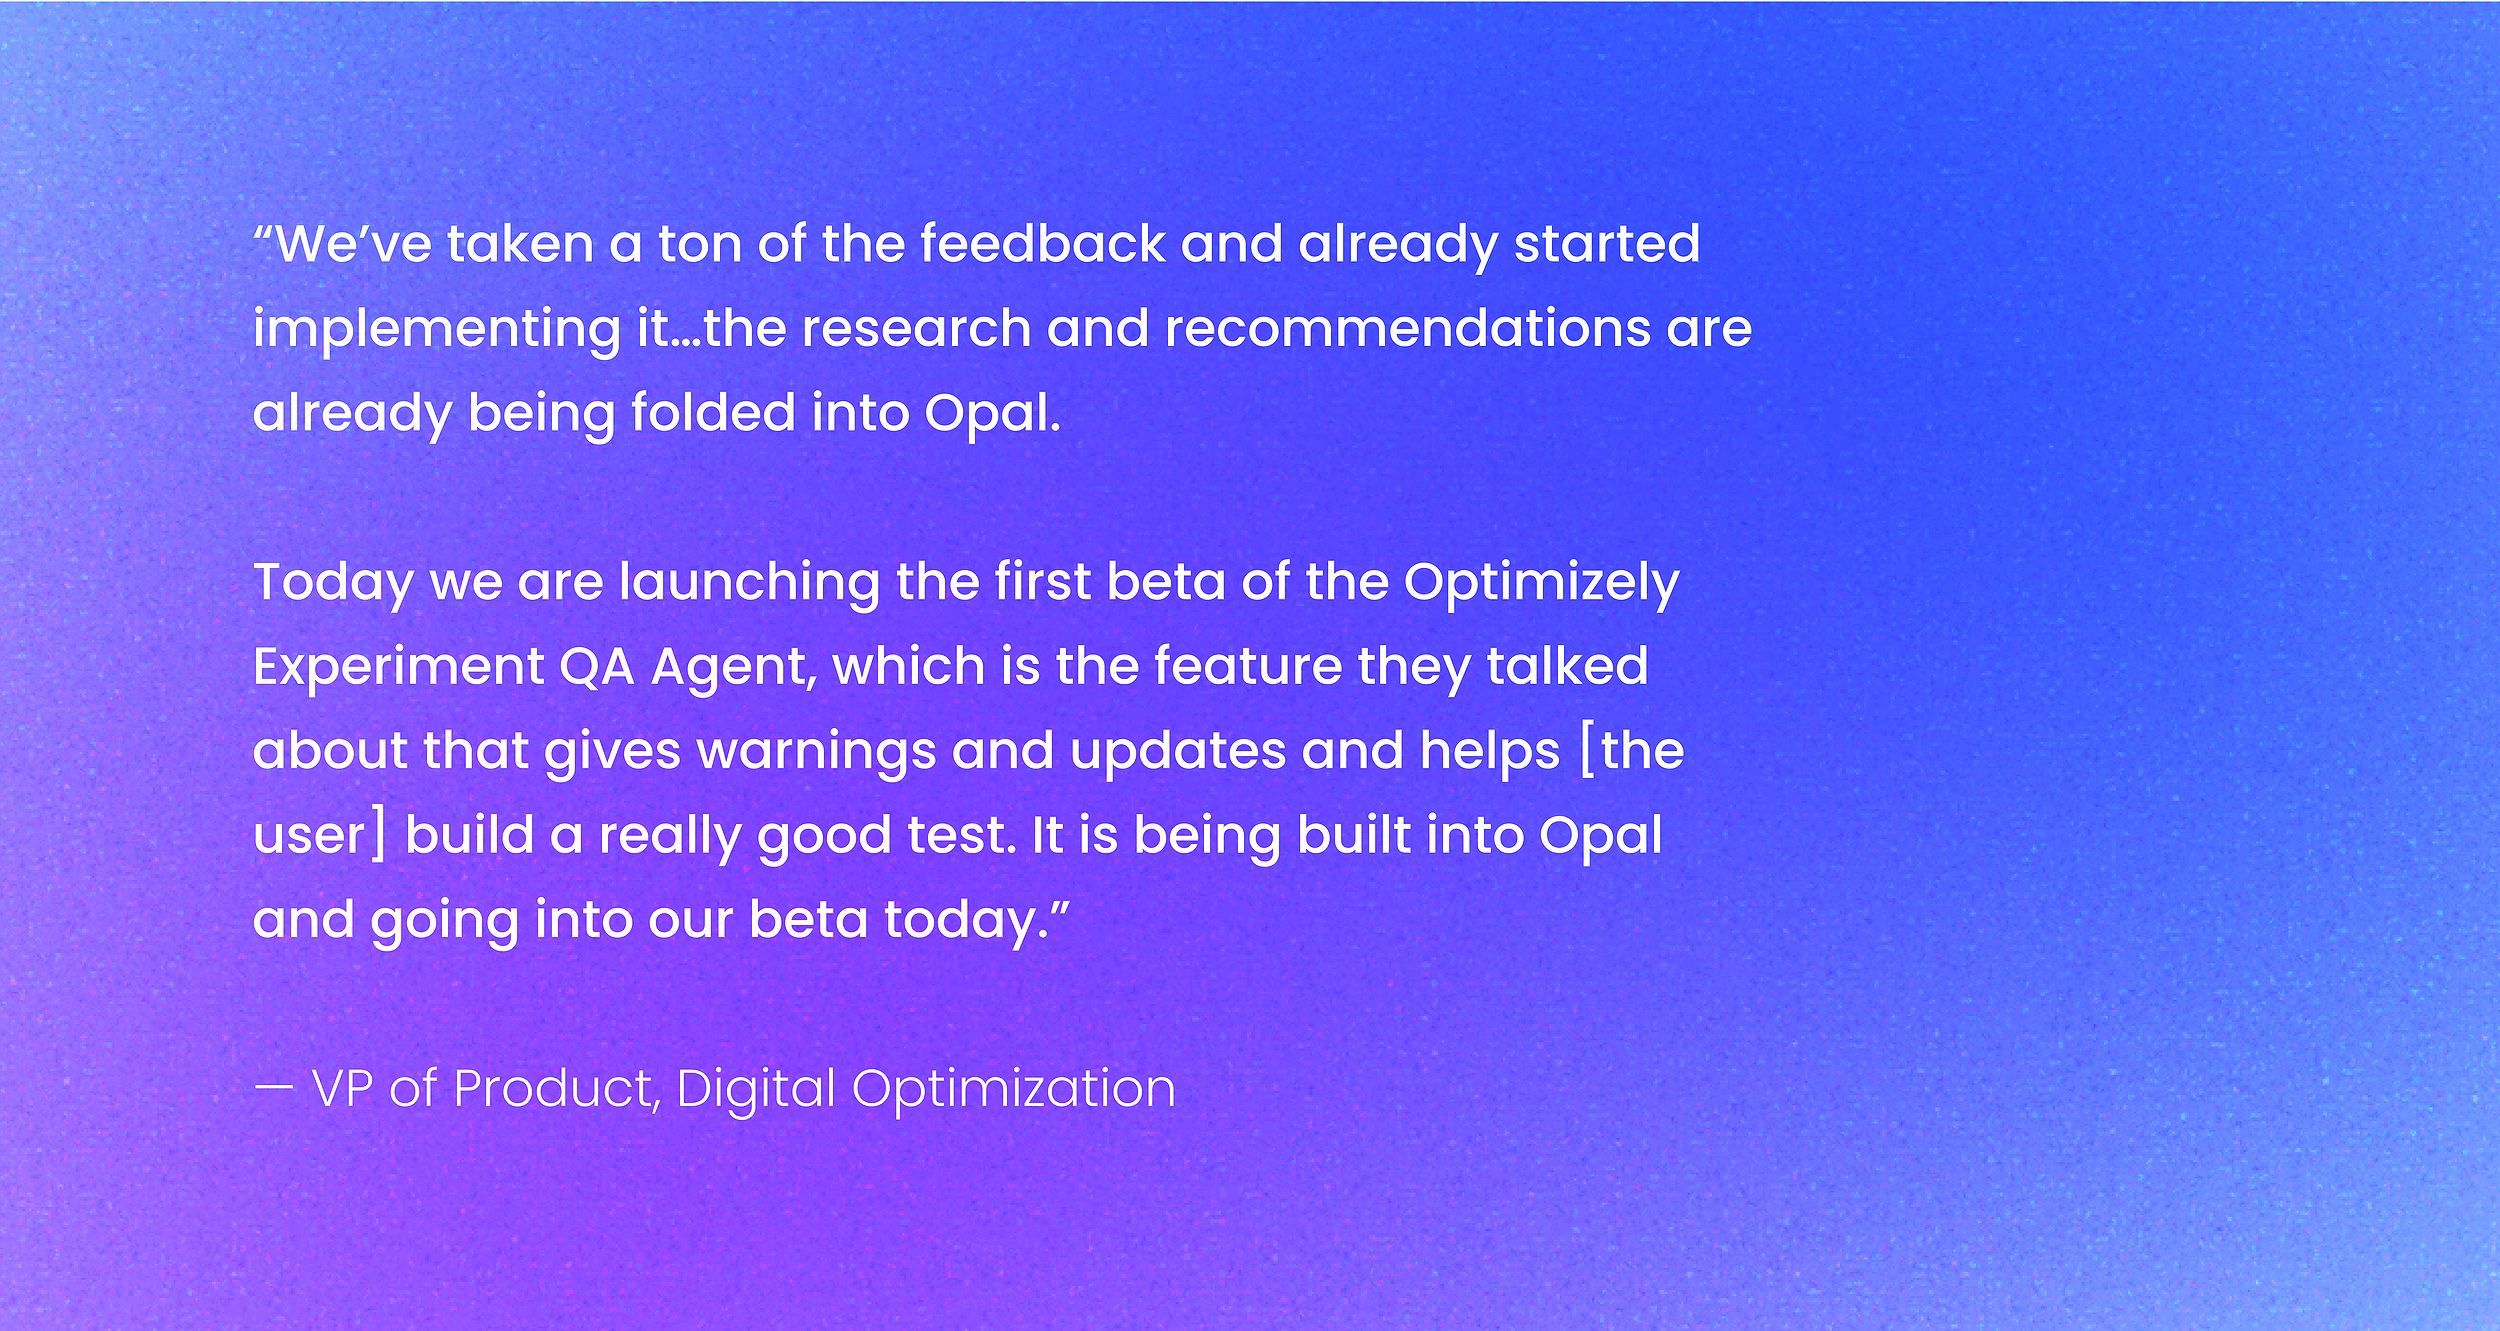
The research I helped shape directly influenced Optimizely’s product roadmap.
Our recommendations didn't stop at insights. A similar feature Optimizely shipped in alignment with our research has shown:

More Tests

Faster Run Times
Beyond what shipped, the research reframed how Optimizely understood its churn problem entirely. The issue was not that users lacked sophistication or motivation. It was that the platform failed to meet them where they were, and that shift in perspective gave the team a much clearer direction going forward.
Reflections
Balancing Task Complexity in Usability Testing
Early in the study design process, there was a real tension within the team about how complex the usability tasks should be. The concern was that oversimplifying them might not reflect the real-world workflows of A/B testing professionals. I advocated for keeping the focus on our target user: non-technical marketers setting up tests independently for the first time. By designing tasks that even the most beginner users could navigate, we were able to capture genuine first reactions to the platform rather than having participants get tripped up by task complexity itself.
When Participants Say It’s Easy, Look Closer
During our sessions, we collected Single Ease Question (SEQ) scores after each task and found that participants frequently rated their completions as easy, even when my observations told a different story. Users who visibly struggled to explain why they had taken certain actions would still give high ease ratings afterward. This gap between perceived and actual understanding was one of the most valuable methodological lessons I took from this study. Quantitative ease scores are useful, but without the qualitative layer of direct observation and follow-up questions, they can mask exactly the kind of confusion you set out to find.